Reverse Engineering – Simple Patching 1

Today we will take a look at how to patch a simple binary using radare2.

You can download, compile and install radare2 from https://github.com/radare/radare2

For my system setup, please check out My current hardware

The test program we will use will be a basic C program that prints a string, here is the code:

#include "stdio.h"

int main(int argc, char **argv) {
	char *string1 = "you lose";
	char *string2 = "you win";

	printf(string1);

	return 0;
}

After you compile, I recommend making a copy to work on to make it easier to recover if you mess something up.

cp re_me_1 re_me_1_patch

If we run the program it should output “you lose”

~/Workspace/C/examples » ./re_me_1                                                         aaron@azurite
you lose% 

Lets open the program in radare2:
Aw tells radare2 to open the file in a writeable mode and analyze all referenced code.

r2 -Aw re_me_1_patch

If you aren’t familiar with radare2, I’d highly recommend reviewing their introductory guide here https://radare.gitbooks.io/radare2book/content/.

The first thing I like to do is look for interesting strings in the binary:

iz will show us strings parsed from the data section.

[0x00401040]> iz
[Strings]
Num Paddr      Vaddr      Len Size Section  Type  String
000 0x00002010 0x00402010   8   9 (.rodata) ascii you lose
001 0x00002019 0x00402019   7   8 (.rodata) ascii you win

So when we ran the program it displayed “you lose”. We want the program to display “you win” instead so lets see where the text is referenced and figure out how it’s being used. We can search for the string a few ways:

axt will find data references to a specific address, so we can use it like this:

[0x0000201d]> axt 0x00402010
sym.main 0x401135 [DATA] mov qword [local_8h], str.first_string

You can also make radare2 use the output of one command within a new command. So instead of writing 0x00402010 we can do:
axt `iz~:2[2]`
The `iz~:2[2]` part takes the 3rd row and 3rd column from the iz command.

[0x00402010]> iz
[Strings]
Num Paddr      Vaddr      Len Size Section  Type  String
000 0x00002010 0x00402010   8   9 (.rodata) ascii you lose
001 0x00002019 0x00402019   7   8 (.rodata) ascii you win

[0x00402010]> axt `iz~:2[2]`
sym.main 0x401135 [DATA] mov qword [format], str.you_lose
[0x00402010]>

From here, we see that the string was referenced by sym.main at address 0x401135. Lets seek there and see what’s going on:

s 0x401135
print ddisassemble function will print the function at our current address

[0x00401135]> pdf
            ;-- main:
/ (fcn) sym.main 55
|   sym.main (int argc, char **argv, char **envp);
|           ; var char **local_20h @ rbp-0x20
|           ; var int local_14h @ rbp-0x14
|           ; var int local_10h @ rbp-0x10
|           ; var char *format @ rbp-0x8
|           ; arg int argc @ rdi
|           ; arg char **argv @ rsi
|           ; DATA XREF from entry0 (0x401061)
|           0x00401126      55             push rbp
|           0x00401127      4889e5         mov rbp, rsp
|           0x0040112a      4883ec20       sub rsp, 0x2
|0
|           0x0040112e      897dec         mov dword [local_14h], edi  ; argc
|           0x00401131      488975e0       mov qword [local_20h], rsi  ; argv
|           ;-- hit0_0:
|           0x00401135  ~   48c745f81020.  mov qword [format], str.you_lose ; 0x402010 ; "you lose"
|           ;-- hit0_1:
..
|           0x0040113d      48c745f01920.  mov qword [local_10h], str.you_win ; 0x402019 ; "you win"
|           0x00401145      488b45f8       mov rax, qword [format]
|           0x00401149      4889c7         mov rdi, rax                ; const char *format
|           0x0040114c      b800000000     mov eax, 0
|           0x00401151      e8dafeffff     call sym.imp.printf         ; int printf(const char *format)
|           0x00401156      b800000000     mov eax, 0
|           0x0040115b      c9             leave
\           0x0040115c      c3             ret

So the interesting bits are:

|           0x00401135  ~   48c745f81020.  mov qword [format], str.you_lose ;
|           0x0040113d      48c745f01920.  mov qword [local_10h], str.you_win ; 0x402019 ; "you win"

This part shows us that the strings “you lose” and “you win” are stored in local variables.

afvd local_10h will show the actual location of the variable relative to the base pointer

[0x00401135]> afvd local_10h
pxr $w @rbp-0x10

Now lets take a look at the following

|           0x00401145      488b45f8       mov rax, qword [format]

It looks like this is where the local variable is moved into the register RAX right before the call to printf. So all we should have to do is change this line to mov the local_10h variable (rbp-0x10) into rax instead. Let’s try!

V will take us into visual mode, then use p to cycle through until you get to the disassembly view.

Once you’re in disassembly view, type o and then 0x00401145 to seek to the offset of the above line.

Now we press A to bring up the assemble command. If we type the following,

mov rax, [rbp-0x10]

you will notice radare2 start to change the line automatically to

mov rax, qword [local_10h]

Once satisfied, press enter and if you type everything correctly it should ask to save your changes. Save and exit radare2.

Run the program and you should see the text “you win”

~/Workspace/C/examples » ./re_me_1_patch                                                   aaron@azurite
you win% 


My new lab setup

I’ve recently made a few upgrades to my home lab. What started as just a single server and some third party router firmware has transformed.. drastically.

VM Host:
HP DL380 G7, 2 Xeons, 32GB RAM (Fedora Server)

Storage server:
ML110 G7, 4 2TB HDDs, 16GB Ram (FreeNAS)

Network:
Unifi USG4 Pro, Unifi AP, Unifi Managed Switches.

Securing your External Hard drive with LUKS

I recently purchased a new External Hard drive for backing up data, storing VM Disk files and miscellaneous other  files. Some data, like my backups and certain VMs  I wanted encrypted while others (homework, presentations documents, etc) I didn’t. I also wanted to make sure that when I plug my hard drive into a Windows machine I’d be able to view my un-encrypted data.

I created the following partitions:

  1. /dev/sdb1 – FAT32 400G
  2. /dev/sdb2 – Remaining space on the drive (formatted initially to Ext4)

Here’s the output from fdisk:

Screenshot from 2017-11-19 09-55-42

Then we format:

mkfs.vfat -F32 /dev/sdb1 

After that, you should be able to browse and add files to your first partition.

Now, we want to setup the encrypted second partition using LUKS.

cryptsetup luksFormat /dev/sdb2 

Follow the steps to set up your  passphrase. Make sure you are using a secure, but memorable passphrase! If you lose it, there is no way to recover your files in this partition!

Now, we need to open our encrypted partition:

cryptsetup luksOpen /dev/sdb2 luks-encrypted-part

This will decrypt our partition, and map it to /dev/mapper/luks-encrypted-part

Now, we just need to format this new device:

mkfs.ext4 /dev/mapper/luks-encrypted-part

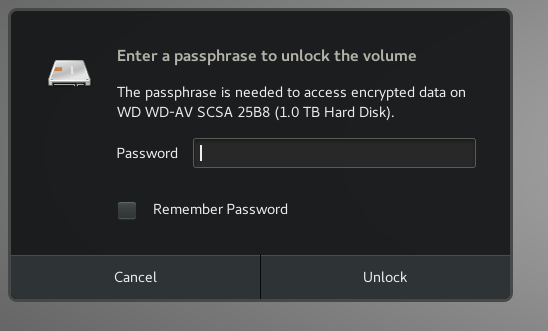
Now, you can mount this device wherever you wish and use it just as you would any other storage device. Every file stored in this partition will be encrypted. Whenever you want to mount the partition, you will be prompted for your passphrase:

Screenshot from 2017-11-19 10-15-30


Creating a Centralized Log Server with Elastic Software on CentOS7


Before we start setting up our honeypot network environment we need to set up a centralized log server so that we can monitor what is actually going on in our environment. From there, we will be able to start creating rules based on the traffic and logs we see to allow/block traffic and further study what is going on in our network and honeypot environment.

There are multiple options to choose from when it comes to log management. Splunk is usually the most common but it can be costly. I’ve set up a Graylog server before but it didn’t quite satisfy me. After some investigating, I stumbled upon Kibana, and the Elastic software stack and feel like it is the perfect log management tool for our home lab.

Instead of having one large article explaining the details of my setup, I’m going to try and split it off into multiple smaller articles.

  1. Installing Elasticsearch, Logstash, and Kibana on CentOS 7
  2. Pushing DD-WRT and pfSense Logs to Logstash & Elasticsearch


Pushing DD-WRT and pfSense Logs to Logstash & Elasticsearch


Now that we have our Elastic software installed we need to get logs flowing into the applications.

Elastic’s website has a great model to show how the three products we’ve installed work together.

https://www.elastic.co/products

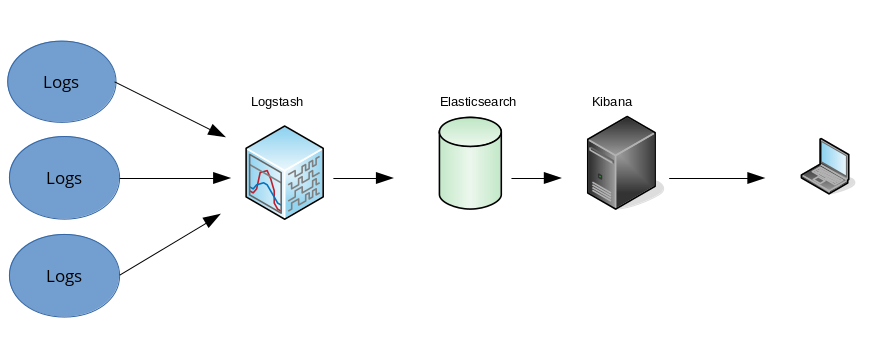
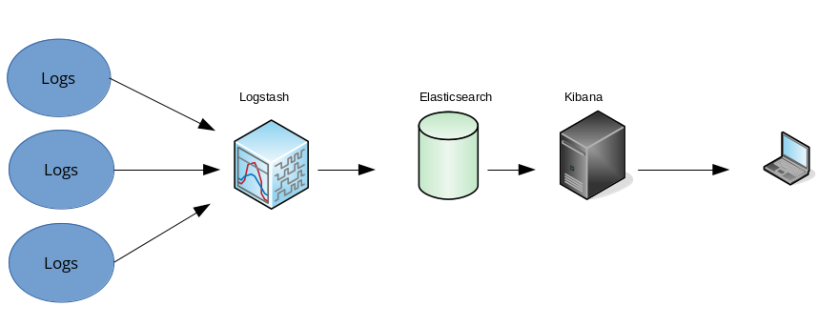
Basically, it looks something like this:

Configuring Elastic Services_htm_e3d619105d75a027

Logs come in from across your environment and get processed via Logstash plugins. The processed data gets sent to Elasticsearch for storage/indexing and presented to the end users via Kibana. This is just an extremely brief overview of how I understand the process works anyway.

Configuring Logstash

Elastic’s online documentation has a great model for how Logstash works:

Configuring Elastic Services_htm_7d66630892a6f64e

(taken directly from https://www.elastic.co/guide/en/logstash/current/first-event.html)

Logstash receives data via inputs(known as plugins) such as files and syslog events, optionally filters them, and sends them on their way via outputs (in our case, our output will be Elasticsearch).

We want to create an input that will receive logs from our DD-WRT router and pfSense firewall. To do that, we need first need to install and configure an input for Logstash.

DD-WRT and pfSense send ‘syslog’ logs, but they aren’t in the correct format to be parsed by the syslog input so instead of using that input, we will have to use the UDP input. You can install it with the following command:

logstash-plugin install logstash-input-udp

Since we want to send our logs to our elastic search server, we also need the Elasticsearch output:

logstash-plugin install logstash-output-elasticsearch

Next we need to create our Logstash configuration file. By default, this is read from the logstash service from /etc/logstash/conf.d/

vim /etc/logstash/conf.d/out-inputs.conf 

and then add the following:

input { 
 udp { port => “51500” } 
} 
output {
 elasticsearch { hosts => [“localhost:9200”] }
} 

This will tell Logstash to listen for logs sent via UDP on port 51500. When it receives these logs, it will forward them to our Elasticsearch server. Since Elasticsearch and and Logstash are running on the same server it is just sent to localhost:9200 (the default elasticsearch port).

We now need to reload and restart the Logstash service:

systemctl daemon-reload 
systemctl restart logstash 

We also need to allow our server to receive UDP packets on port 51500. So we need the following firewall rule:

firewall-cmd --permanent --add-port=51500/udp
firewall-cmd --reload 

Now we can set up DD-WRT to send logs to our Logstash server:

Go to Services to the Services tab and configure your System Log settings:

Configuring Elastic Services_htm_ecd49cae016d470e

(my Logstash server is running at IP 10.0.0.5)

And then Apply settings.

Next, Go to the Firewall Tab and enable Firewall Logging:

Configuring Elastic Services_htm_87c41ea4bfeb1ed5

Once again, apply settings.

Now, if you have Kibana setup you should start to see logs coming from DD-WRT:

Configuring Elastic Services_htm_cd5f5fc735c3fa95.png

Next we want to set up pfSense to do the same thing.

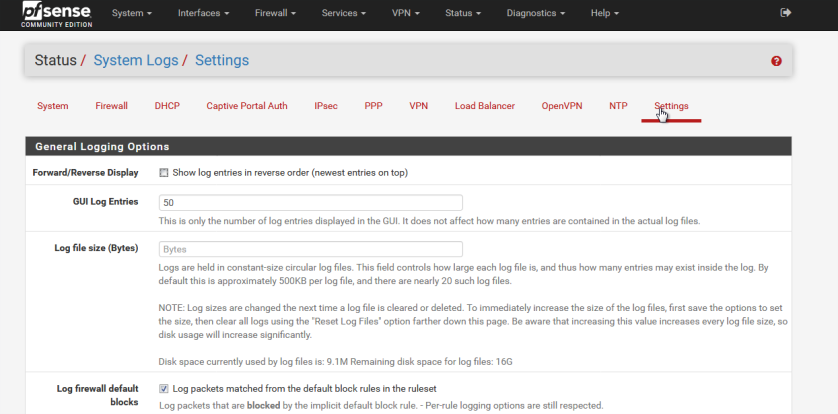
Go to Status → System Logs in pfSense and then open the Settings link:

Configuring Elastic Services_htm_d3e99e4cb5d154bf

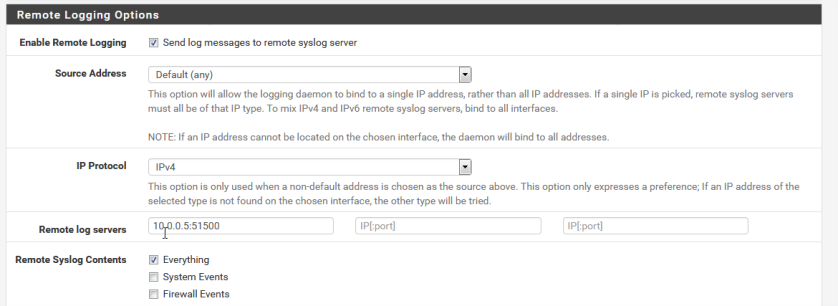
Scroll down and configure remote logging:

Configuring Elastic Services_htm_c2ffb6adc60f16c2

Click save and your done!

Now you’re getting logs from both pfSense and DD-WRT in one centralized and easy to manage interface.

Installing Elasticsearch, Logstash, and Kibana on CentOS 7

Logstash, Elasticsearch and Kibana is a great software stack for log management. In this article I will go over the process of installing it on CentOS 7 and then follow up with a few articles on configuring different devices to send logs to our server.

Before we continue, I’m going to Disable SELinux. I am working in a home lab and have no real use for it at this point. If you require SELinux then please refer to the official Elastic Documentation.

SELinux is beyond the scope of this guide, if you are unsure whether or not you want or need to disable it I suggest you read up more on the purpose of having it enabled.

sudo vim /etc/selinux/config

Install Elasticservices_htm_acc050cffdc00f5

Then reboot.

We also need to Install the following dependencies:

Java:

yum install java-1.8.0-openjdk-devel java-1.8.0-openjdk-headless 

And configure the Elastic repository:

1. Download and install Elastic’s Public key to sign packages

rpm --import https://artifacts.elastic.co/GPG-KEY-elasticsearch

2. Create the following following RPM Repository file:

vim /etc/yum.repos.d/elastic.repo 
[elasticsearch-5.x] 
name=Elasticsearch repository for 5.x packages 
baseurl=https://artifacts.elastic.co/packages/5.x/yum 
gpgcheck=1 
gpgkey=https://artifacts.elastic.co/GPG-KEY-elasticsearch
enabled=1 
autorefresh=1 
type=rpm-md 

Installing Elastic Search

1. Run the following yum command:

yum install elasticsearch 

2. Start and enable the Elasticsearch services via:

systemctl start elasticsearch.service 
systemctl enable elasticsearch.service 

3. Ensure that everything works:

systemctl status elasticsearch 

Install Elasticservices_htm_407f153fed431c60

Elasticsearch configuration options can be found here:

https://www.elastic.co/guide/en/elasticsearch/reference/current/settings.html

Installing Kibana

1. Run the following yum command:

yum install kibana

2. Start and enable the Kibana services:

systemctl start kibana.service
systemctl enable kibana.service

3. Ensure it all works:

systemctl status kibana

Install Elasticservices_htm_7815a9f6697511d7

Kibana configuration options can be found here:

https://www.elastic.co/guide/en/kibana/5.6/settings.html

To allow remote hosts to connect to Kibana, you must do the following as well:

Open Kibana configuration file:

vim /etc/kibana/kibana.yml 

Search for:

server.host: 

And replace it with your server’s IP address.

Install Elasticservices_htm_2fa102d4d5edb54a

And restart Kibana:

systemctl restart kibana

We also need to create a firewall rule to allow remote connections on port 5601(Kibana’s default port).

firewall-cmd --permanent --add-port=5601/tcp
firewall-cmd --reload 

Now browse to your servers IP and port 5601:

Install Elasticservices_htm_3771df8f12c7da5e

Installing Logstash

1. Run the following yum command:

yum install logstash 

2. Start and enable the logstash services:

systemctl start logstash.service
systemctl enable logstash.service

3. Ensure it all works:

systemctl status logstash

Install Elasticservices_htm_d84b442ac5f63ac

Additional configuration options for Logstash can be found here:
https://www.elastic.co/guide/en/logstash/5.6/config-setting-files.html

Creating a Virtual Firewall Network with QEMU/KVM and DD-WRT

This is a LONG writeup, if you wish, here is a link to the PDF version: VirtualFirewalledNetwork

Pretext

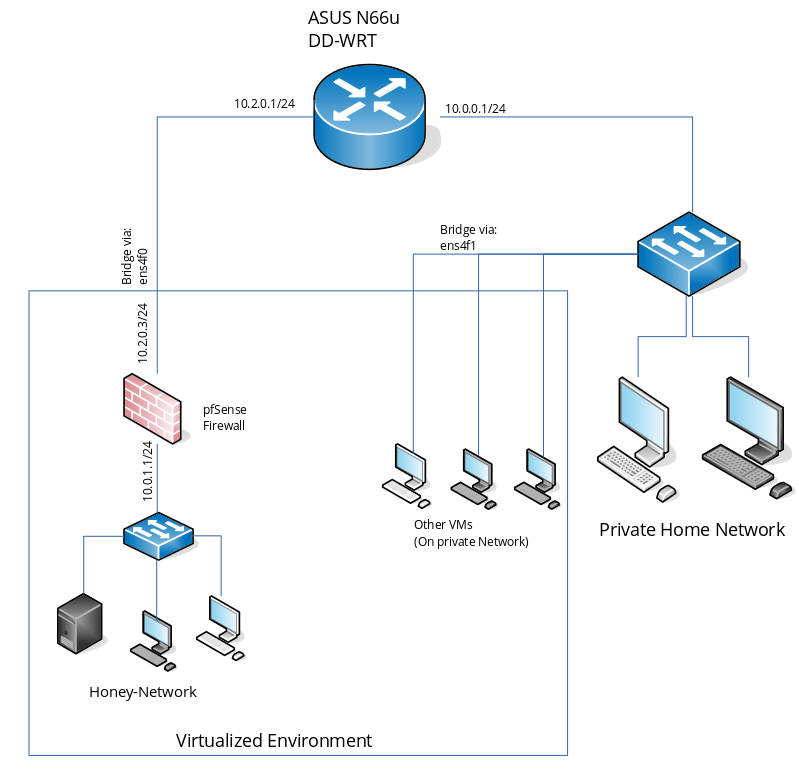
So recently I wanted to create a more secure network for hosting honey pots. Since honeypots are meant to be probed and sometimes pwnd I did not want them on the same network as my other personal devices. I however, don’t have a ton of equipment in my lab to do extremely advanced networking so instead of using hardware, we virutalized the environment! In the end, our logical environment looks something like the following:

HoneyNetwork_htm_379aea80a1cf55bb

Physical Lab Layout

Our physical structure looking like the following:

HoneyNetwork_htm_d4cb9f87d5c2a641

My home-lab setup consist of the following hardware:

  • HP ML110 G7 Home Server

    • 3 HDDs in a LVM volume group (This is where I store ISOs/VMDisks)

    • Dual Port PCI NIC Card

  • ASUS N66U

  • My Laptop (Thinkpad T460)

And the following Software:

  • CentOS 7 – Host OS on the ML110

    • QEMU/KVM installed (what we will be using to create VMs)

    • VNCServer – Sometimes we like to VNC into the box to see whats going on

  • DD-WRT – Installed on the ASUS N66U

  • Fedora 26 – Installed on Laptop

    • Virtual Machine Manager – How we will connect remotely to our VM host

The exact server is NOT required for this to work neither is CentOS. You can instead use any old(but moderately powerful & virtualization ready) desktop with a stable Linux distro that supports QEMU/KVM. I will not be going over how to install CentOS or QEMU/KVM in this article. You WILL need to have an extra NIC port on the server though if you want to run some VMs on your LAN and some in the firewalled network!

DD-WRT is what I will be using to create my separate networks, so it, or a firmware that supports VLANs/network isolation is required.

Fedora is also not required, but it is my preference. Virtual Machine Manager is available for many Linux distributions so you can use your favorite distro.

Creating an Isolated VLAN network with DD-WRT

When we create honeypots, we do NOT want to jeopardize our own private home network. With DD-WRT we can create a separate network to attach our VMs to in order to keep them isolated away from our other personal devices.

1. Go to setup > VLANs and pick a port to place on a separate VLAN.

HoneyNetwork_htm_36d6db9be8cd93a5

Here, I chose to assign port #1 to VLAN 3. Then apply your settings. If you do not have a cable plugged into the port, the status indicator above will be red (see ports 2 and 3 in the example). If you have a cable plugged in, the status indicator will be green(W, 1 and 4). Try to use a port with nothing plugged into it, if none are available try to figure our a way to free up a port as any traffic coming off the port in the future will be separated from the rest of the network!

2. Go to Setup > Networking and create a new bridge. You can name it what you like.

HoneyNetwork_htm_5fc5ea7cd79ceb0e

I have three bridges, you may only have two. For this tutorial I will be using “br2”.

3. After you created a new bridge, assign your new VLAN to the new bridge:

HoneyNetwork_htm_6144909e921bf0a0

Here, I assigned vlan3 to br2. This will allow your VLAN to share your WAN port and therefore provide your new subnet with internet access.

4. Scroll down a little and you will see the new network configuration section for your bridge:

HoneyNetwork_htm_6532d7f593a5291e

Here you MUST enable “Net Isolation”. This will make sure that any traffic coming from this subnet will not reach your other subnets.

For the IP address, use whatever value you want but make sure it is in a different subnet than your private LAN! My LAN is in the range 10.0.0.0/24, so for my subnet I used 10.2.0.0/24.

5. Make sure you then click Apply Settings! Your router may restart after this, but it’s okay!

You now have a new subnet on your home network. Remember what port that VLAN is on, and then continue to creating the VM environment!

Creating a Virtual Network and Machines with QEMU/KVM

Now that we have a private subnet set up, we need to create some VM (or VMs) to run on the network, and a VM for our pfSense firewall. I will demonstrate doing this in Virtual Machine Manager.

1. In Virtual Machine Manager go to Edit > Connection Details > Virtual Networks.

HoneyNetwork_htm_ebaa633b36d9fa46

2. Then click the ‘+’ at the bottom of the list.

HoneyNetwork_htm_305ef81d47256557

Name it whatever you like.

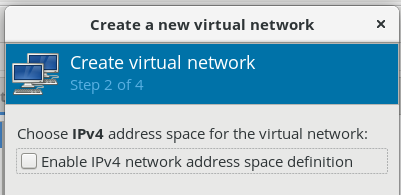
3. Un-check ‘Enable IPv4 network address space definition’. This is useful to have enabled if you want the virtual network to also act as a router/gateway/dhcp server. We instead want to handle these tasks through pfSense so we need to disable it.

HoneyNetwork_htm_f5eeb7bc41a7df35

4. Same case for IPv6

HoneyNetwork_htm_bdad8a092de9fe17

5. Make sure ‘Isolated Virtual network’ is selected then click finish!

HoneyNetwork_htm_40f0faa9845efafc

Now we have a virtual network created. This is going to be our firewalled network. Every device in this network is isolated away from our private network and in the event of a compromise, can easily be dealt with. What you now created, is the equivalent of a virtual switch. Now, we need to add a client to this switch to be the honeypot and pfSense to the switch to act as our router/gateway.

6. Create a client VM in Virtual Machine Manager and assign the new network to the virtual NIC port. I am not going to go over all the steps to create a VM in Virtual Machine Manager, but when you get to the networking step, this is what it should look like:

HoneyNetwork_htm_6cdefaff6697f10e

This will attach our new VM to our new network.

7. Create ANOTHER VM but for pfSense instead and do the SAME thing for the network selection. Except this time make sure you check ‘Customize configuration before install’.

HoneyNetwork_htm_9db03e7587ac2ac8

8. Now on the new screen, click ‘add hardware’ at the bottom of the list and click Network:

HoneyNetwork_htm_fd9e81cd6d3105a9

This time, instead of the network source being the firewalled network, you want to select the NIC port of the server that is connected to the port you assigned the new VLAN to earlier! I created my new VLAN on port 1 on my router, that port is connected to interface ‘enp2s0’ on my server so that is what I selected here. You also want to make sure you are select ‘Bridge’ as the source mode!

What this does, is give pfSense one NIC inside the firewalled network, and one NIC connected directly to our new VLAN gateway (which is bridged through our router to the internet). Thus, allowing network traffic to flow from our firewalled network to the internet but ONLY through pfSense, which is exactly what we want.

Installing & Configuring a pfSense Virtual Machine

So now we have the following, a private sub-net on our router, a virtual switch with two VMs connected (our honeypot & pfSense) and pfSense with two NIC ports installed (one inside the honey net, one inside our private sub-net). Now, we need to configure pfSense to act as a gateway. This will allow our machines inside the virtual network to connect to the internet through pfSense (so that then we can do some real fire-walling on our virtual machines if we need to). To do that, we need to configure pfSense. So once you install pfSense on a virtual machine you should see the following:

HoneyNetwork_htm_cf24411036b5c21a

1. Lets set up our WAN and LAN interfaces. The LAN interface will be the NIC port of pfSense that is inside our virtual network and the WAN interface will be the NIC port of pfSense that is connected to our sub-net gateway. So press 1.

HoneyNetwork_htm_1abd0508c05c3e46

The re0 and re1 are both of my virtual NICs I installed to the pfSense VM. To figure out which one is in which sub-net go to View > Details on the virtual machine window. On the left side of the window, it will show you the last 3 bytes (hextets?) of the MAC address. Just match these up to what pfSense shows. The one bridged to your server’s NIC will be what we set up as the WAN port and the one in the virtual network will be the LAN port.

Once you have figure this our, go back to View > Console and press ‘n’ since we won’t be setting up any VLANs now.

2. Now we just enter the interface that will be connected to the WAN. For me, it was the MAC address ending with :69 so here I type re1 and press enter.

HoneyNetwork_htm_eb53d1b2a66f0310

3. Now we set up the LAN, do the same thing as above just use the LAN interface instead (for me it was re0).

4. Press y if everything looks correct

HoneyNetwork_htm_aa07bfbea96e2cfb

Now you should be back at the main pfSense menu and your WAN and LAN interfaces should both be assigned. Now we need to assign the IP addresses to the interfaces. Since the virtual network will be in its own subnet, you will need to think of an addressing scheme. I’m going to use the 10.0.1.1/24 network for my subnet.

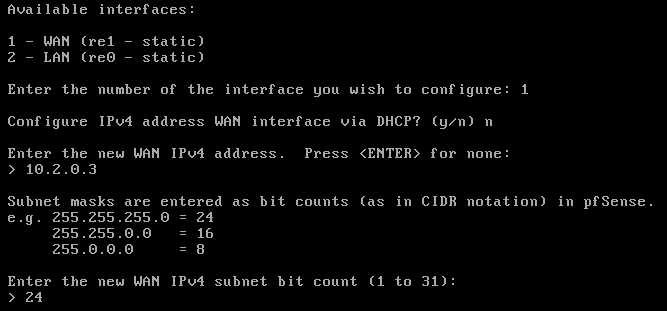
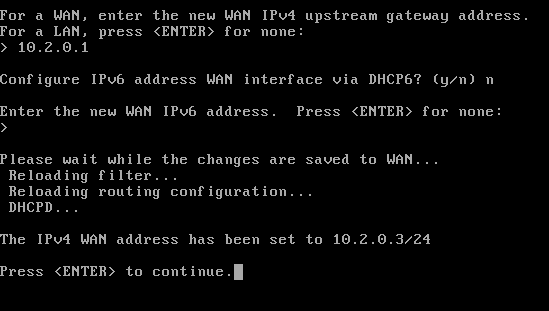
2. Press 2 to set up the IP addresses. Then select 1 (or whichever option corresponds to your WAN interface). You probably won’t have an IP for your WAN interface yet since we didn’t set up DHCP on the sub-net, so you can enter in any IP address in your sub-net that you like, since my gateway is 10.2.0.1 and my server’s NIC port is 10.2.0.2 I opted for 10.2.0.3.

HoneyNetwork_htm_f74b02ff146b64b9

3. Now we need to set up the upstream gateway IP address. This will be the IP that all traffic coming into pfSense will be forwarded to. In our case, its the 10.2.0.1 bridge we set up on our router earlier. Then enter nothing in for the IPv6 options.

HoneyNetwork_htm_b54e2765a2dd2d62

5. Now perform the same steps(2 & 3) as above to set up our LAN interface IP. If you look at my virtualization diagram in the prefix, you will see my firewalled network subnet is 10.0.1.0/24. So for my LAN interface IP I assigned it the address 10.0.1.1

Ensuring everything works

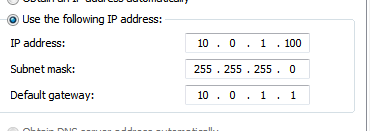
Honestly, that’s about all there is to it! By default, pfSense will allow all traffic from the LAN and forward it to the upstream gateway so if you log into your VM on the firewalled network you should now be able to set up your IP address information like so:

HoneyNetwork_htm_e831481ace272dfd

And you will have an internet connection, through pfSense, on your virtual honey-network!

Now you can set up VMs inside this network, to act as honeypots and filter all traffic however you wish through pfSense!

You can log into pfSense web interface from the private network by browsing to your gateway IP: 10.0.1.1

HoneyNetwork_htm_c7ad5ac4f8c97a54

Setting up Greylog in CentOS7

I decided to learn more about log management, how to track down incidents, and how to extract useful information from large amounts of data(logs). The reason for this setup is so that eventually I can create a honeypot environment and I would like to have a single repository to pull information from.

I set Graylog up on a QEMU/KVM Virtual Machine running CentOS 7. Initially I gave the VM 1GB of RAM and a 4 core vCPU. This may change later, depending on how many logs are being received. I just used the minimal CentOS install since we will be installing all other resources as we need them.

I’m not going to go into setting up Graylog here, as they have fantastic documentation on setting it up for RHEL/CentOS here:

Graylog 2.3 Setup

Notes on setup:

  1. Since I am not running this in a production environment, I saved myself some headache and disabled SELinux.
  2. I had trouble installing the Graylog Repo directly to the server. In order to fix that I downloaded the RPM manually and transferred the .rpm via SCP to the server.
  3. Remember to set up a static IP!

Please thoroughly follow the instructions in that guide! They do a much better job at explaining things than I can.

First thoughts:

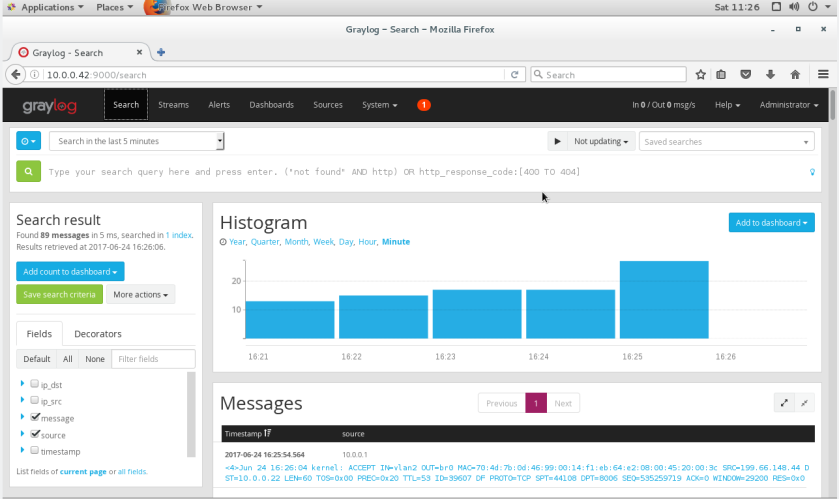
Graylog

The Web Interface is super nice.

There are a ton of features, the search function is extremely powerful, and it allows you to pull specific fields from your log messages and do all sorts of cool things with them. Once we have logs anyway… (This image is deceiving, I had already had some logs being forwarded at this time)

Getting Logs into our server

First, if you’re using an OS with a firewall (which I hope you are!!!!!) open the port that you’ll be using for log traffic.

Then read this, once again, their documentation is fantastic and goes over most of this in details:

http://docs.graylog.org/en/2.2/pages/sending_data.html

Basically the process goes something like this:

  1. Create an input
  2. Start input
  3. Forward logs from X server via whichever method you used to create the input to the port you specified (and opened in your firewall!)
  4. Check your log server and see if logs are coming in!

Parsing data

This is where I am currently at. I now have logs coming in from my router, VM host, and a few windows machines but haven’t created any extractors for them yet. So I have some raw messsages that I have to do some very explicit searching for, which isn’t tooo bad but you can’t make a ton of cool graphs and stuff with it yet..

This article explains extractors and how to create them nicely:

http://docs.graylog.org/en/2.2/pages/extractors.html

I’ll update more once I get some message extracting done!

My current hardware

Daily driver:

I am currently using a Lenovo T460 running Fedora. This laptop is the most sturdy and well built machine I’ve ever used. The keyboard feels fantastic. And the dual battery (23WHr built in + 72WHr removable) lasts FOREVER. I seriously have worked for 12hrs straight without needing to charge this thing. The 14in screen is a perfect not too big, not too small ratio as well.

Current homelab setup:

  • Ubiquiti USG Pro4, Ubiquiti AC Pro, Ubiquiti Managed PoE Switch
  • Some small 5port dumb switch
  • HP ML110 G7, 9TB Raid 5 Array running FreeNAS
  • HP DL380 G7, 32GB RAM, 2TB Raid 5, Network ports everywhere running CentOS + KVM/Qemu